library(tidyverse) # Manipulação de tabelas e gráficos
library(stringi) # Detectar encoding da tabela
library(hrbrthemes) # Tema para gráficos
library(viridis) # Paleta de cores para gráficos
library(psych) # Análises estatísticas descritivas
library(Hmisc) # Análises estatísticas descritivas
library(pastecs) # Análises estatísticas descritivas
library(DataExplorer) # Análises estatísticas descritivasO que é estatística descritiva?
A estatística descritiva é um etapa inicial importante para entender nossos dados. Ao utilizar algumas funções e pacotes que ajudam a descrever os dados, nós podemos saber a quantidade de linhas e colunas da tabela, a quantidade de variáveis numéricas discretas (números inteiros) e contínuas (valores infinitos), quantidade de variáveis categóricas, dados faltantes e número total de observações.

A estatística descritiva também nos permite fazer um resumo dos nossos dados para avaliar a frequência da distribuição de variáveis numéricas através de histogramas, identificar médias, medianas, valores máximos e mínimos, desvios e erros padrão, e fazer correlações entre variáveis.
Para fazer essas análises de forma rápida, nós podemos usar um eficiente pacote chamado DataExplorer, o qual gera um relatório completo em PDF ou HTML da análise exploratória dos dados. Em breve será apresentado como utilizar esse pacote.
Base de dados Kaggle
Para fazer análises exploratórias de dados e praticar a linguagem R, podemos baixar conjuntos de dados de diversas áreas do conhecimento na plataforma Kaggle, que é a maior comunidade de ciência de dados do mundo e serve para explorar, analisar e compartilhar dados de qualidade.

A base de dados que selecionei para fazer a estatística descritiva está disponíel para baixar em .csv nesse link e fala sobre os fatores de estresse em estudantes.
Acompanhe as etapas abaixo para fazer as análises estatísticas descritivas dessa base selecionada.
Carregar pacotes
Carregar dados
stringi::stri_enc_detect('StressLevelDataset.csv')
dados <- read.csv('StressLevelDataset.csv') # Para datasets separados por ",".
Visualização de dados
tibble(dados[1:5, ])# A tibble: 5 × 21
anxiety_level self_esteem mental_health_history depression headache
<int> <int> <int> <int> <int>
1 14 20 0 11 2
2 15 8 1 15 5
3 12 18 1 14 2
4 16 12 1 15 4
5 16 28 0 7 2
# ℹ 16 more variables: blood_pressure <int>, sleep_quality <int>,
# breathing_problem <int>, noise_level <int>, living_conditions <int>,
# safety <int>, basic_needs <int>, academic_performance <int>,
# study_load <int>, teacher_student_relationship <int>,
# future_career_concerns <int>, social_support <int>, peer_pressure <int>,
# extracurricular_activities <int>, bullying <int>, stress_level <int>glimpse(dados)Rows: 1,100
Columns: 21
$ anxiety_level <int> 14, 15, 12, 16, 16, 20, 4, 17, 13, 6, 17,…
$ self_esteem <int> 20, 8, 18, 12, 28, 13, 26, 3, 22, 8, 12, …
$ mental_health_history <int> 0, 1, 1, 1, 0, 1, 0, 1, 1, 0, 1, 1, 0, 1,…
$ depression <int> 11, 15, 14, 15, 7, 21, 6, 22, 12, 27, 25,…
$ headache <int> 2, 5, 2, 4, 2, 3, 1, 4, 3, 4, 4, 3, 1, 4,…
$ blood_pressure <int> 1, 3, 1, 3, 3, 3, 2, 3, 1, 3, 3, 3, 2, 3,…
$ sleep_quality <int> 2, 1, 2, 1, 5, 1, 4, 1, 2, 1, 1, 1, 4, 1,…
$ breathing_problem <int> 4, 4, 2, 3, 1, 4, 1, 5, 4, 2, 3, 5, 2, 0,…
$ noise_level <int> 2, 3, 2, 4, 3, 3, 1, 3, 3, 0, 4, 5, 2, 1,…
$ living_conditions <int> 3, 1, 2, 2, 2, 2, 4, 1, 3, 5, 2, 2, 3, 2,…
$ safety <int> 3, 2, 3, 2, 4, 2, 4, 1, 3, 2, 1, 1, 5, 4,…
$ basic_needs <int> 2, 2, 2, 2, 3, 1, 4, 1, 3, 2, 1, 1, 5, 3,…
$ academic_performance <int> 3, 1, 2, 2, 4, 2, 5, 1, 3, 2, 1, 1, 5, 1,…
$ study_load <int> 2, 4, 3, 4, 3, 5, 1, 3, 3, 2, 3, 3, 2, 2,…
$ teacher_student_relationship <int> 3, 1, 3, 1, 1, 2, 4, 2, 2, 1, 1, 1, 4, 3,…
$ future_career_concerns <int> 3, 5, 2, 4, 2, 5, 1, 4, 3, 5, 4, 4, 1, 3,…
$ social_support <int> 2, 1, 2, 1, 1, 1, 3, 1, 3, 1, 1, 1, 3, 0,…
$ peer_pressure <int> 3, 4, 3, 4, 5, 4, 2, 4, 3, 5, 4, 5, 1, 1,…
$ extracurricular_activities <int> 3, 5, 2, 4, 0, 4, 2, 4, 2, 3, 4, 5, 1, 0,…
$ bullying <int> 2, 5, 2, 5, 5, 5, 1, 5, 2, 4, 5, 4, 1, 1,…
$ stress_level <int> 1, 2, 1, 2, 1, 2, 0, 2, 1, 1, 2, 2, 0, 2,…Estatística Descritiva
Função summary()
summary(dados$anxiety_level) Min. 1st Qu. Median Mean 3rd Qu. Max.
0.00 6.00 11.00 11.06 16.00 21.00 summary(dados$self_esteem) Min. 1st Qu. Median Mean 3rd Qu. Max.
0.00 11.00 19.00 17.78 26.00 30.00 summary(dados$depression) Min. 1st Qu. Median Mean 3rd Qu. Max.
0.00 6.00 12.00 12.56 19.00 27.00 summary(dados$sleep_quality) Min. 1st Qu. Median Mean 3rd Qu. Max.
0.00 1.00 2.50 2.66 4.00 5.00 summary(dados$noise_level) Min. 1st Qu. Median Mean 3rd Qu. Max.
0.000 2.000 3.000 2.649 3.000 5.000 summary(dados$living_conditions) Min. 1st Qu. Median Mean 3rd Qu. Max.
0.000 2.000 2.000 2.518 3.000 5.000 summary(dados$basic_needs) Min. 1st Qu. Median Mean 3rd Qu. Max.
0.000 2.000 3.000 2.773 4.000 5.000 summary(dados$study_load) Min. 1st Qu. Median Mean 3rd Qu. Max.
0.000 2.000 2.000 2.622 3.000 5.000 summary(dados$academic_performance) Min. 1st Qu. Median Mean 3rd Qu. Max.
0.000 2.000 2.000 2.773 4.000 5.000 summary(dados$teacher_student_relationship) Min. 1st Qu. Median Mean 3rd Qu. Max.
0.000 2.000 2.000 2.648 4.000 5.000 summary(dados$social_support) Min. 1st Qu. Median Mean 3rd Qu. Max.
0.000 1.000 2.000 1.882 3.000 3.000 summary(dados$bullying) Min. 1st Qu. Median Mean 3rd Qu. Max.
0.000 1.000 3.000 2.617 4.000 5.000 summary(dados$stress_level) Min. 1st Qu. Median Mean 3rd Qu. Max.
0.0000 0.0000 1.0000 0.9964 2.0000 2.0000 Função describe()
describe(dados)dados
21 Variables 1100 Observations
--------------------------------------------------------------------------------
anxiety_level
n missing distinct Info Mean Gmd .05 .10
1100 0 22 0.998 11.06 7.051 1 2
.25 .50 .75 .90 .95
6 11 16 19 21
lowest : 0 1 2 3 4, highest: 17 18 19 20 21
--------------------------------------------------------------------------------
self_esteem
n missing distinct Info Mean Gmd .05 .10
1100 0 31 0.998 17.78 10.21 2 4
.25 .50 .75 .90 .95
11 19 26 29 30
lowest : 0 1 2 3 4, highest: 26 27 28 29 30
--------------------------------------------------------------------------------
mental_health_history
n missing distinct Info Sum Mean Gmd
1100 0 2 0.75 542 0.4927 0.5003
--------------------------------------------------------------------------------
depression
n missing distinct Info Mean Gmd .05 .10
1100 0 28 0.998 12.56 8.871 1 2
.25 .50 .75 .90 .95
6 12 19 24 26
lowest : 0 1 2 3 4, highest: 23 24 25 26 27
--------------------------------------------------------------------------------
headache
n missing distinct Info Mean Gmd
1100 0 6 0.947 2.508 1.577
Value 0 1 2 3 4 5
Frequency 32 331 181 287 140 129
Proportion 0.029 0.301 0.165 0.261 0.127 0.117
For the frequency table, variable is rounded to the nearest 0
--------------------------------------------------------------------------------
blood_pressure
n missing distinct Info Mean Gmd
1100 0 3 0.866 2.182 0.8934
Value 1 2 3
Frequency 300 300 500
Proportion 0.273 0.273 0.455
For the frequency table, variable is rounded to the nearest 0
--------------------------------------------------------------------------------
sleep_quality
n missing distinct Info Mean Gmd
1100 0 6 0.954 2.66 1.743
Value 0 1 2 3 4 5
Frequency 34 328 188 170 188 192
Proportion 0.031 0.298 0.171 0.155 0.171 0.175
For the frequency table, variable is rounded to the nearest 0
--------------------------------------------------------------------------------
breathing_problem
n missing distinct Info Mean Gmd
1100 0 6 0.949 2.754 1.572
Value 0 1 2 3 4 5
Frequency 43 179 325 139 287 127
Proportion 0.039 0.163 0.295 0.126 0.261 0.115
For the frequency table, variable is rounded to the nearest 0
--------------------------------------------------------------------------------
noise_level
n missing distinct Info Mean Gmd
1100 0 6 0.95 2.649 1.481
Value 0 1 2 3 4 5
Frequency 36 188 313 289 137 137
Proportion 0.033 0.171 0.285 0.263 0.125 0.125
For the frequency table, variable is rounded to the nearest 0
--------------------------------------------------------------------------------
living_conditions
n missing distinct Info Mean Gmd
1100 0 6 0.933 2.518 1.236
Value 0 1 2 3 4 5
Frequency 29 176 346 327 189 33
Proportion 0.026 0.160 0.315 0.297 0.172 0.030
For the frequency table, variable is rounded to the nearest 0
--------------------------------------------------------------------------------
safety
n missing distinct Info Mean Gmd
1100 0 6 0.951 2.737 1.576
Value 0 1 2 3 4 5
Frequency 33 184 348 180 184 171
Proportion 0.030 0.167 0.316 0.164 0.167 0.155
For the frequency table, variable is rounded to the nearest 0
--------------------------------------------------------------------------------
basic_needs
n missing distinct Info Mean Gmd
1100 0 6 0.954 2.773 1.61
Value 0 1 2 3 4 5
Frequency 40 173 335 190 173 189
Proportion 0.036 0.157 0.305 0.173 0.157 0.172
For the frequency table, variable is rounded to the nearest 0
--------------------------------------------------------------------------------
academic_performance
n missing distinct Info Mean Gmd
1100 0 6 0.95 2.773 1.586
Value 0 1 2 3 4 5
Frequency 28 185 348 169 188 182
Proportion 0.025 0.168 0.316 0.154 0.171 0.165
For the frequency table, variable is rounded to the nearest 0
--------------------------------------------------------------------------------
study_load
n missing distinct Info Mean Gmd
1100 0 6 0.948 2.622 1.465
Value 0 1 2 3 4 5
Frequency 37 185 333 275 142 128
Proportion 0.034 0.168 0.303 0.250 0.129 0.116
For the frequency table, variable is rounded to the nearest 0
--------------------------------------------------------------------------------
teacher_student_relationship
n missing distinct Info Mean Gmd
1100 0 6 0.95 2.648 1.549
Value 0 1 2 3 4 5
Frequency 42 190 353 183 192 140
Proportion 0.038 0.173 0.321 0.166 0.175 0.127
For the frequency table, variable is rounded to the nearest 0
--------------------------------------------------------------------------------
future_career_concerns
n missing distinct Info Mean Gmd
1100 0 6 0.954 2.649 1.721
Value 0 1 2 3 4 5
Frequency 30 327 199 173 185 186
Proportion 0.027 0.297 0.181 0.157 0.168 0.169
For the frequency table, variable is rounded to the nearest 0
--------------------------------------------------------------------------------
social_support
n missing distinct Info Mean Gmd
1100 0 4 0.873 1.882 1.13
Value 0 1 2 3
Frequency 88 412 142 458
Proportion 0.080 0.375 0.129 0.416
For the frequency table, variable is rounded to the nearest 0
--------------------------------------------------------------------------------
peer_pressure
n missing distinct Info Mean Gmd
1100 0 6 0.95 2.735 1.595
Value 0 1 2 3 4 5
Frequency 37 181 355 172 174 181
Proportion 0.034 0.165 0.323 0.156 0.158 0.165
For the frequency table, variable is rounded to the nearest 0
--------------------------------------------------------------------------------
extracurricular_activities
n missing distinct Info Mean Gmd
1100 0 6 0.954 2.767 1.593
Value 0 1 2 3 4 5
Frequency 34 184 332 178 198 174
Proportion 0.031 0.167 0.302 0.162 0.180 0.158
For the frequency table, variable is rounded to the nearest 0
--------------------------------------------------------------------------------
bullying
n missing distinct Info Mean Gmd
1100 0 6 0.953 2.617 1.724
Value 0 1 2 3 4 5
Frequency 39 335 167 199 187 173
Proportion 0.035 0.305 0.152 0.181 0.170 0.157
For the frequency table, variable is rounded to the nearest 0
--------------------------------------------------------------------------------
stress_level
n missing distinct Info Mean Gmd
1100 0 3 0.889 0.9964 0.8949
Value 0 1 2
Frequency 373 358 369
Proportion 0.339 0.325 0.335
For the frequency table, variable is rounded to the nearest 0
--------------------------------------------------------------------------------Estatística descritiva com o pacote Hmisc
describe(dados)dados
21 Variables 1100 Observations
--------------------------------------------------------------------------------
anxiety_level
n missing distinct Info Mean Gmd .05 .10
1100 0 22 0.998 11.06 7.051 1 2
.25 .50 .75 .90 .95
6 11 16 19 21
lowest : 0 1 2 3 4, highest: 17 18 19 20 21
--------------------------------------------------------------------------------
self_esteem
n missing distinct Info Mean Gmd .05 .10
1100 0 31 0.998 17.78 10.21 2 4
.25 .50 .75 .90 .95
11 19 26 29 30
lowest : 0 1 2 3 4, highest: 26 27 28 29 30
--------------------------------------------------------------------------------
mental_health_history
n missing distinct Info Sum Mean Gmd
1100 0 2 0.75 542 0.4927 0.5003
--------------------------------------------------------------------------------
depression
n missing distinct Info Mean Gmd .05 .10
1100 0 28 0.998 12.56 8.871 1 2
.25 .50 .75 .90 .95
6 12 19 24 26
lowest : 0 1 2 3 4, highest: 23 24 25 26 27
--------------------------------------------------------------------------------
headache
n missing distinct Info Mean Gmd
1100 0 6 0.947 2.508 1.577
Value 0 1 2 3 4 5
Frequency 32 331 181 287 140 129
Proportion 0.029 0.301 0.165 0.261 0.127 0.117
For the frequency table, variable is rounded to the nearest 0
--------------------------------------------------------------------------------
blood_pressure
n missing distinct Info Mean Gmd
1100 0 3 0.866 2.182 0.8934
Value 1 2 3
Frequency 300 300 500
Proportion 0.273 0.273 0.455
For the frequency table, variable is rounded to the nearest 0
--------------------------------------------------------------------------------
sleep_quality
n missing distinct Info Mean Gmd
1100 0 6 0.954 2.66 1.743
Value 0 1 2 3 4 5
Frequency 34 328 188 170 188 192
Proportion 0.031 0.298 0.171 0.155 0.171 0.175
For the frequency table, variable is rounded to the nearest 0
--------------------------------------------------------------------------------
breathing_problem
n missing distinct Info Mean Gmd
1100 0 6 0.949 2.754 1.572
Value 0 1 2 3 4 5
Frequency 43 179 325 139 287 127
Proportion 0.039 0.163 0.295 0.126 0.261 0.115
For the frequency table, variable is rounded to the nearest 0
--------------------------------------------------------------------------------
noise_level
n missing distinct Info Mean Gmd
1100 0 6 0.95 2.649 1.481
Value 0 1 2 3 4 5
Frequency 36 188 313 289 137 137
Proportion 0.033 0.171 0.285 0.263 0.125 0.125
For the frequency table, variable is rounded to the nearest 0
--------------------------------------------------------------------------------
living_conditions
n missing distinct Info Mean Gmd
1100 0 6 0.933 2.518 1.236
Value 0 1 2 3 4 5
Frequency 29 176 346 327 189 33
Proportion 0.026 0.160 0.315 0.297 0.172 0.030
For the frequency table, variable is rounded to the nearest 0
--------------------------------------------------------------------------------
safety
n missing distinct Info Mean Gmd
1100 0 6 0.951 2.737 1.576
Value 0 1 2 3 4 5
Frequency 33 184 348 180 184 171
Proportion 0.030 0.167 0.316 0.164 0.167 0.155
For the frequency table, variable is rounded to the nearest 0
--------------------------------------------------------------------------------
basic_needs
n missing distinct Info Mean Gmd
1100 0 6 0.954 2.773 1.61
Value 0 1 2 3 4 5
Frequency 40 173 335 190 173 189
Proportion 0.036 0.157 0.305 0.173 0.157 0.172
For the frequency table, variable is rounded to the nearest 0
--------------------------------------------------------------------------------
academic_performance
n missing distinct Info Mean Gmd
1100 0 6 0.95 2.773 1.586
Value 0 1 2 3 4 5
Frequency 28 185 348 169 188 182
Proportion 0.025 0.168 0.316 0.154 0.171 0.165
For the frequency table, variable is rounded to the nearest 0
--------------------------------------------------------------------------------
study_load
n missing distinct Info Mean Gmd
1100 0 6 0.948 2.622 1.465
Value 0 1 2 3 4 5
Frequency 37 185 333 275 142 128
Proportion 0.034 0.168 0.303 0.250 0.129 0.116
For the frequency table, variable is rounded to the nearest 0
--------------------------------------------------------------------------------
teacher_student_relationship
n missing distinct Info Mean Gmd
1100 0 6 0.95 2.648 1.549
Value 0 1 2 3 4 5
Frequency 42 190 353 183 192 140
Proportion 0.038 0.173 0.321 0.166 0.175 0.127
For the frequency table, variable is rounded to the nearest 0
--------------------------------------------------------------------------------
future_career_concerns
n missing distinct Info Mean Gmd
1100 0 6 0.954 2.649 1.721
Value 0 1 2 3 4 5
Frequency 30 327 199 173 185 186
Proportion 0.027 0.297 0.181 0.157 0.168 0.169
For the frequency table, variable is rounded to the nearest 0
--------------------------------------------------------------------------------
social_support
n missing distinct Info Mean Gmd
1100 0 4 0.873 1.882 1.13
Value 0 1 2 3
Frequency 88 412 142 458
Proportion 0.080 0.375 0.129 0.416
For the frequency table, variable is rounded to the nearest 0
--------------------------------------------------------------------------------
peer_pressure
n missing distinct Info Mean Gmd
1100 0 6 0.95 2.735 1.595
Value 0 1 2 3 4 5
Frequency 37 181 355 172 174 181
Proportion 0.034 0.165 0.323 0.156 0.158 0.165
For the frequency table, variable is rounded to the nearest 0
--------------------------------------------------------------------------------
extracurricular_activities
n missing distinct Info Mean Gmd
1100 0 6 0.954 2.767 1.593
Value 0 1 2 3 4 5
Frequency 34 184 332 178 198 174
Proportion 0.031 0.167 0.302 0.162 0.180 0.158
For the frequency table, variable is rounded to the nearest 0
--------------------------------------------------------------------------------
bullying
n missing distinct Info Mean Gmd
1100 0 6 0.953 2.617 1.724
Value 0 1 2 3 4 5
Frequency 39 335 167 199 187 173
Proportion 0.035 0.305 0.152 0.181 0.170 0.157
For the frequency table, variable is rounded to the nearest 0
--------------------------------------------------------------------------------
stress_level
n missing distinct Info Mean Gmd
1100 0 3 0.889 0.9964 0.8949
Value 0 1 2
Frequency 373 358 369
Proportion 0.339 0.325 0.335
For the frequency table, variable is rounded to the nearest 0
--------------------------------------------------------------------------------Gmd: quando não são utilizados pesos, a diferença média de Gini é calculada para variáveis numéricas. Isto é um medida robusta de dispersão que é a diferença média absoluta entre quaisquer pares de observações.
Estatística descritiva com o pacote pastecs
stat.desc(dados) anxiety_level self_esteem mental_health_history depression
nbr.val 1.100000e+03 1.100000e+03 1.100000e+03 1.100000e+03
nbr.null 2.900000e+01 2.400000e+01 5.580000e+02 4.400000e+01
nbr.na 0.000000e+00 0.000000e+00 0.000000e+00 0.000000e+00
min 0.000000e+00 0.000000e+00 0.000000e+00 0.000000e+00
max 2.100000e+01 3.000000e+01 1.000000e+00 2.700000e+01
range 2.100000e+01 3.000000e+01 1.000000e+00 2.700000e+01
sum 1.217000e+04 1.955500e+04 5.420000e+02 1.381100e+04
median 1.100000e+01 1.900000e+01 0.000000e+00 1.200000e+01
mean 1.106364e+01 1.777727e+01 4.927273e-01 1.255545e+01
SE.mean 1.844513e-01 2.696898e-01 1.508083e-02 2.329781e-01
CI.mean.0.95 3.619165e-01 5.291651e-01 2.959047e-02 4.571321e-01
var 3.742452e+01 8.000585e+01 2.501745e-01 5.970666e+01
std.dev 6.117558e+00 8.944599e+00 5.001745e-01 7.727008e+00
coef.var 5.529428e-01 5.031480e-01 1.015114e+00 6.154304e-01
headache blood_pressure sleep_quality breathing_problem
nbr.val 1.100000e+03 1.100000e+03 1.100000e+03 1.100000e+03
nbr.null 3.200000e+01 0.000000e+00 3.400000e+01 4.300000e+01
nbr.na 0.000000e+00 0.000000e+00 0.000000e+00 0.000000e+00
min 0.000000e+00 1.000000e+00 0.000000e+00 0.000000e+00
max 5.000000e+00 3.000000e+00 5.000000e+00 5.000000e+00
range 5.000000e+00 2.000000e+00 5.000000e+00 5.000000e+00
sum 2.759000e+03 2.400000e+03 2.926000e+03 3.029000e+03
median 3.000000e+00 2.000000e+00 2.500000e+00 3.000000e+00
mean 2.508182e+00 2.181818e+00 2.660000e+00 2.753636e+00
SE.mean 4.249368e-02 2.513322e-02 4.668549e-02 4.223309e-02
CI.mean.0.95 8.337791e-02 4.931451e-02 9.160277e-02 8.286661e-02
var 1.986284e+00 6.948466e-01 2.397489e+00 1.961998e+00
std.dev 1.409356e+00 8.335746e-01 1.548383e+00 1.400713e+00
coef.var 5.619034e-01 3.820550e-01 5.820987e-01 5.086777e-01
noise_level living_conditions safety basic_needs
nbr.val 1.100000e+03 1.100000e+03 1.100000e+03 1.100000e+03
nbr.null 3.600000e+01 2.900000e+01 3.300000e+01 4.000000e+01
nbr.na 0.000000e+00 0.000000e+00 0.000000e+00 0.000000e+00
min 0.000000e+00 0.000000e+00 0.000000e+00 0.000000e+00
max 5.000000e+00 5.000000e+00 5.000000e+00 5.000000e+00
range 5.000000e+00 5.000000e+00 5.000000e+00 5.000000e+00
sum 2.914000e+03 2.770000e+03 3.011000e+03 3.050000e+03
median 3.000000e+00 2.000000e+00 2.000000e+00 3.000000e+00
mean 2.649091e+00 2.518182e+00 2.737273e+00 2.772727e+00
SE.mean 4.004453e-02 3.374539e-02 4.239766e-02 4.322952e-02
CI.mean.0.95 7.857237e-02 6.621267e-02 8.318950e-02 8.482172e-02
var 1.763921e+00 1.252626e+00 1.977317e+00 2.055670e+00
std.dev 1.328127e+00 1.119208e+00 1.406171e+00 1.433761e+00
coef.var 5.013519e-01 4.444508e-01 5.137125e-01 5.170941e-01
academic_performance study_load teacher_student_relationship
nbr.val 1.100000e+03 1.100000e+03 1.100000e+03
nbr.null 2.800000e+01 3.700000e+01 4.200000e+01
nbr.na 0.000000e+00 0.000000e+00 0.000000e+00
min 0.000000e+00 0.000000e+00 0.000000e+00
max 5.000000e+00 5.000000e+00 5.000000e+00
range 5.000000e+00 5.000000e+00 5.000000e+00
sum 3.050000e+03 2.884000e+03 2.913000e+03
median 2.000000e+00 2.000000e+00 2.000000e+00
mean 2.772727e+00 2.621818e+00 2.648182e+00
SE.mean 4.265161e-02 3.967229e-02 4.174661e-02
CI.mean.0.95 8.368778e-02 7.784199e-02 8.191207e-02
var 2.001075e+00 1.731280e+00 1.917058e+00
std.dev 1.414594e+00 1.315781e+00 1.384579e+00
coef.var 5.101813e-01 5.018582e-01 5.228412e-01
future_career_concerns social_support peer_pressure
nbr.val 1100.0000000 1.100000e+03 1.100000e+03
nbr.null 30.0000000 8.800000e+01 3.700000e+01
nbr.na 0.0000000 0.000000e+00 0.000000e+00
min 0.0000000 0.000000e+00 0.000000e+00
max 5.0000000 3.000000e+00 5.000000e+00
range 5.0000000 3.000000e+00 5.000000e+00
sum 2914.0000000 2.070000e+03 3.008000e+03
median 2.0000000 2.000000e+00 2.000000e+00
mean 2.6490909 1.881818e+00 2.734545e+00
SE.mean 0.0461124 3.159316e-02 4.297336e-02
CI.mean.0.95 0.0904783 6.198972e-02 8.431910e-02
var 2.3389892 1.097940e+00 2.031381e+00
std.dev 1.5293754 1.047826e+00 1.425265e+00
coef.var 0.5773209 5.568160e-01 5.212073e-01
extracurricular_activities bullying stress_level
nbr.val 1.100000e+03 1.100000e+03 1.100000e+03
nbr.null 3.400000e+01 3.900000e+01 3.730000e+02
nbr.na 0.000000e+00 0.000000e+00 0.000000e+00
min 0.000000e+00 0.000000e+00 0.000000e+00
max 5.000000e+00 5.000000e+00 2.000000e+00
range 5.000000e+00 5.000000e+00 2.000000e+00
sum 3.044000e+03 2.879000e+03 1.096000e+03
median 2.500000e+00 3.000000e+00 1.000000e+00
mean 2.767273e+00 2.617273e+00 9.963636e-01
SE.mean 4.274111e-02 4.616012e-02 2.477436e-02
CI.mean.0.95 8.386340e-02 9.057192e-02 4.861040e-02
var 2.009483e+00 2.343832e+00 6.751460e-01
std.dev 1.417562e+00 1.530958e+00 8.216727e-01
coef.var 5.122597e-01 5.849440e-01 8.246715e-01Relatório completo com análises exploratórias
Pacote DataExplorer
relatorio <- dados %>%
    create_report(
        output_file = "report.pdf",
        output_format = "pdf_document",
        report_title = "Dataset Kaggle - Estatística Descritiva")
Principais funções do pacote DataExplorer
plot_intro(dados)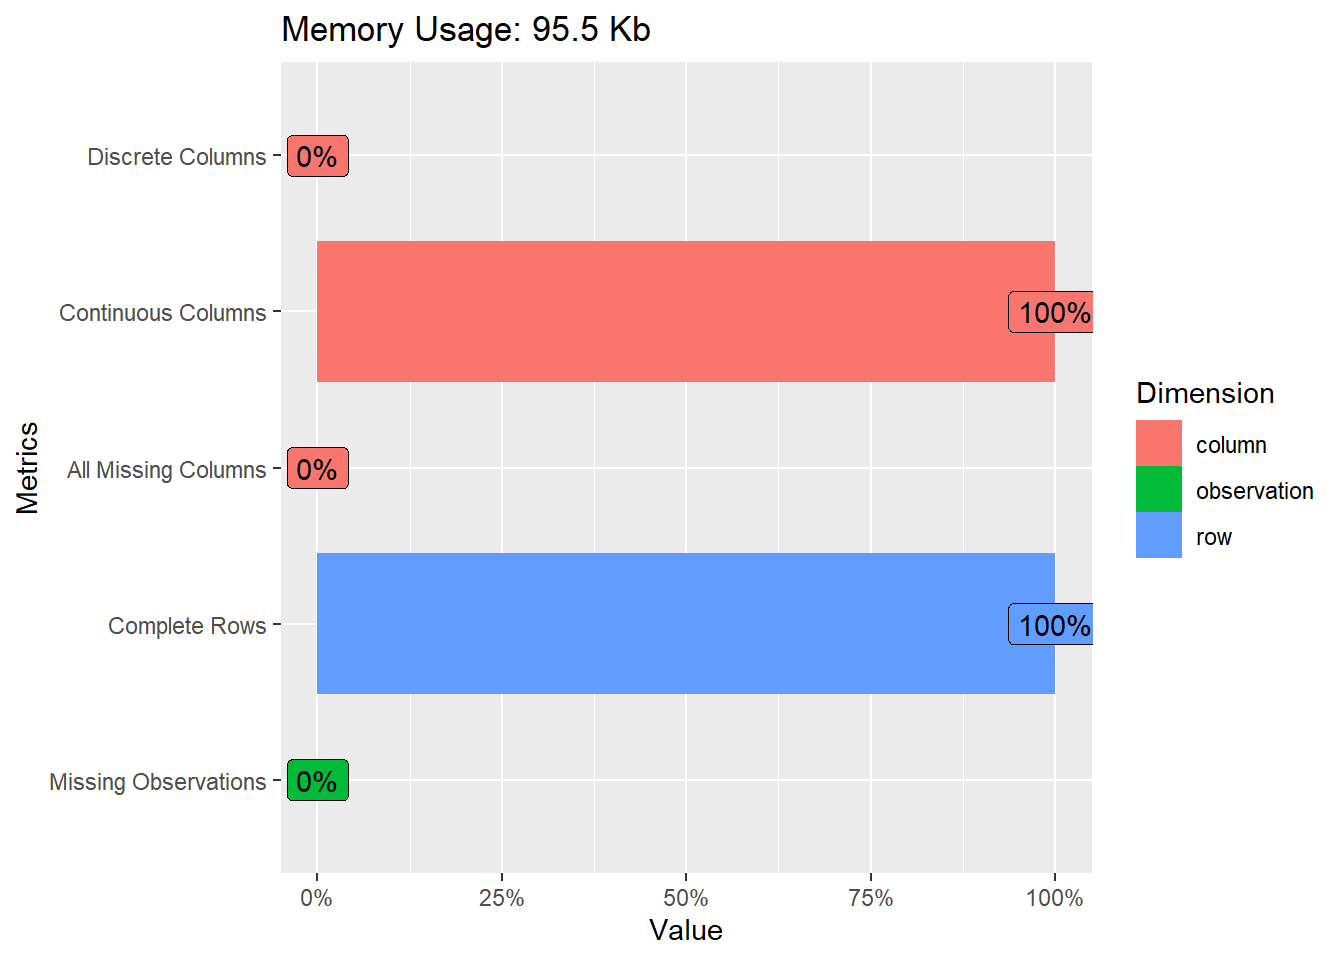
plot_missing(dados)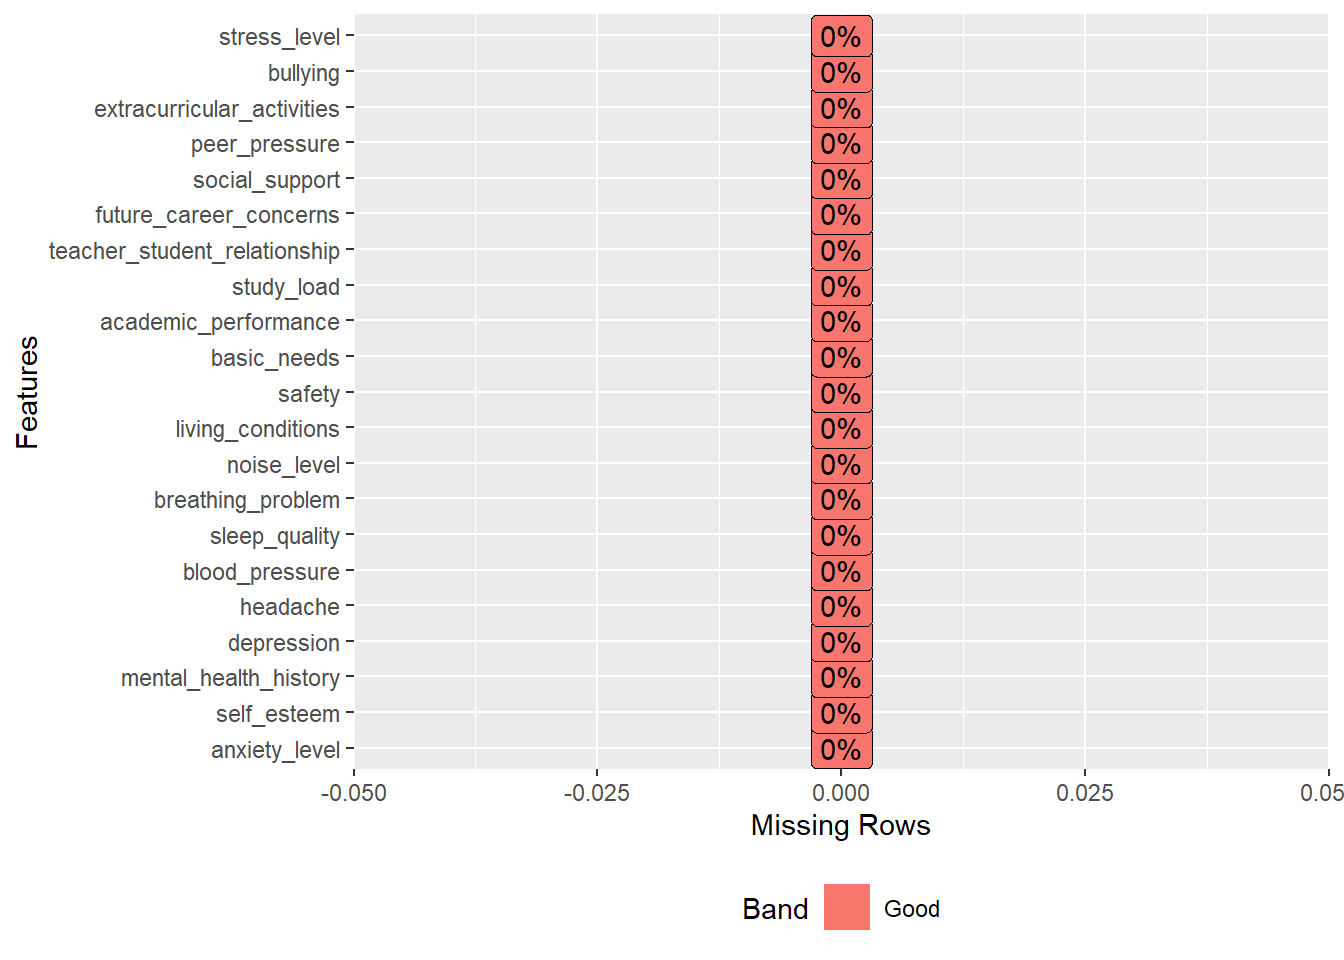
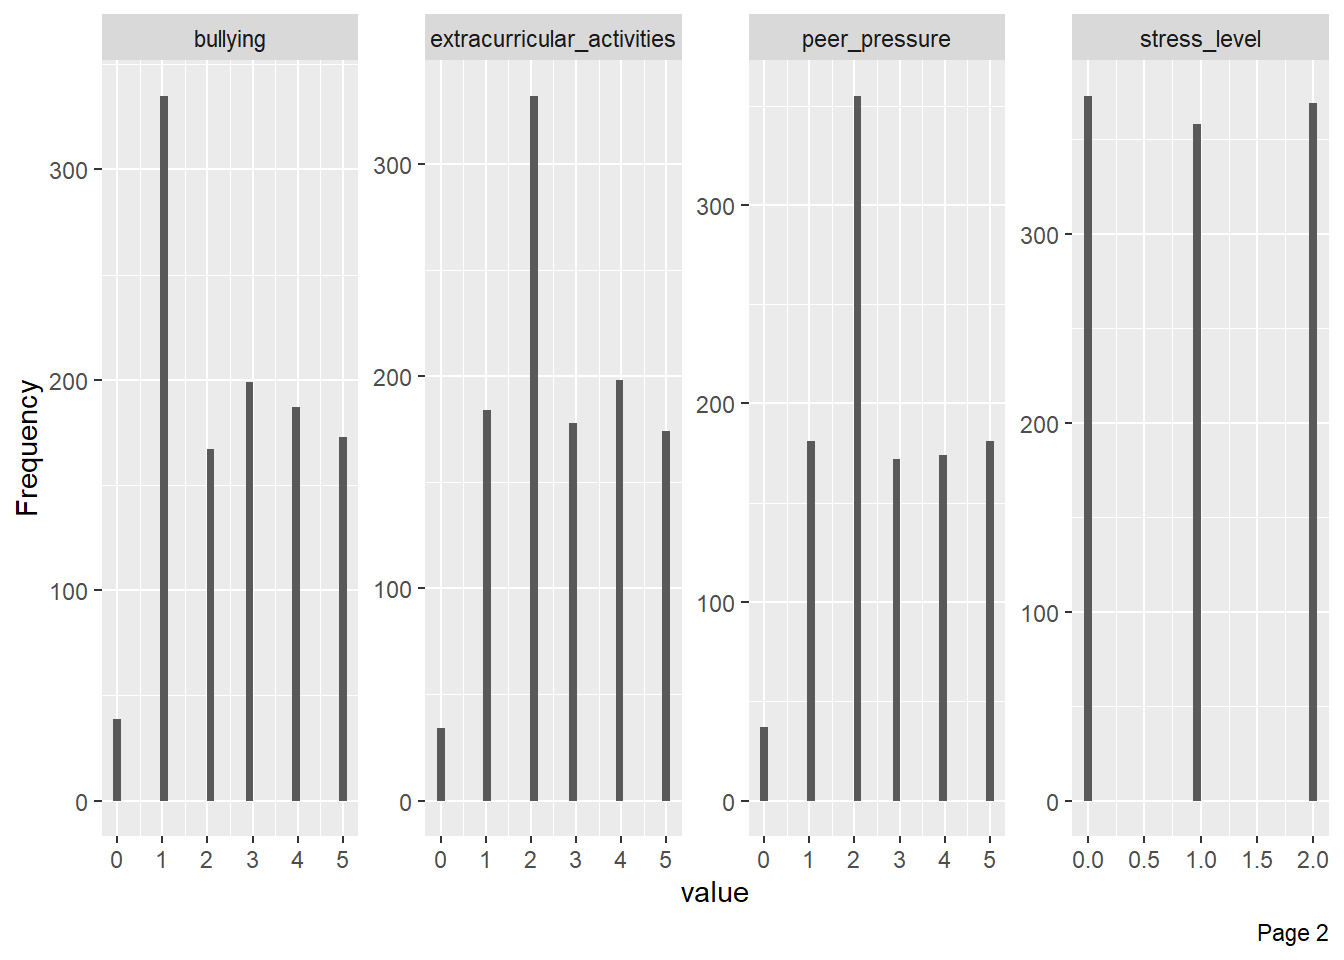
plot_histogram(dados)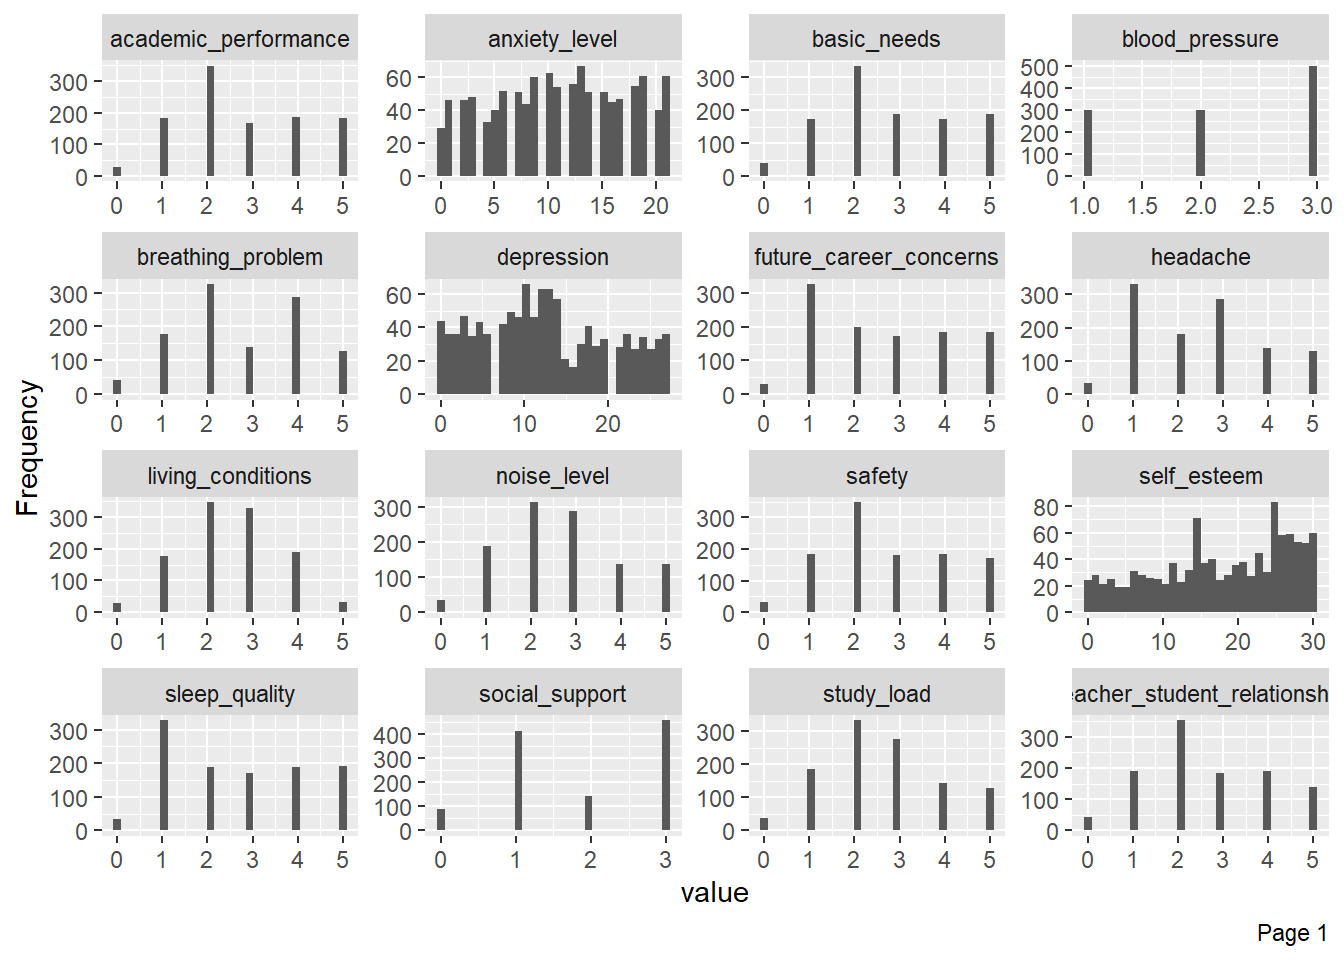
plot_bar(dados) 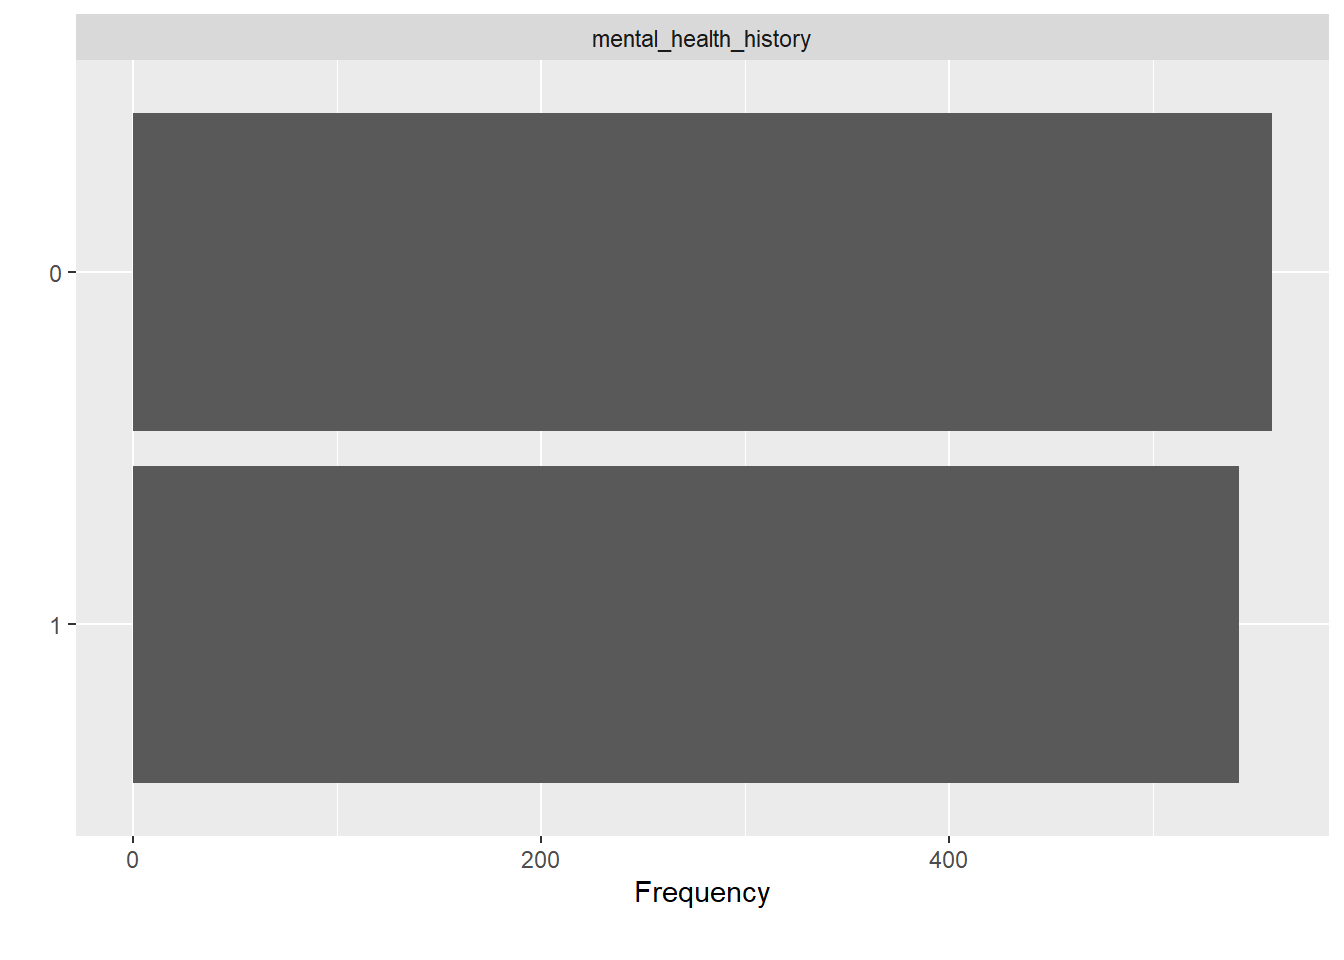
plot_correlation(dados)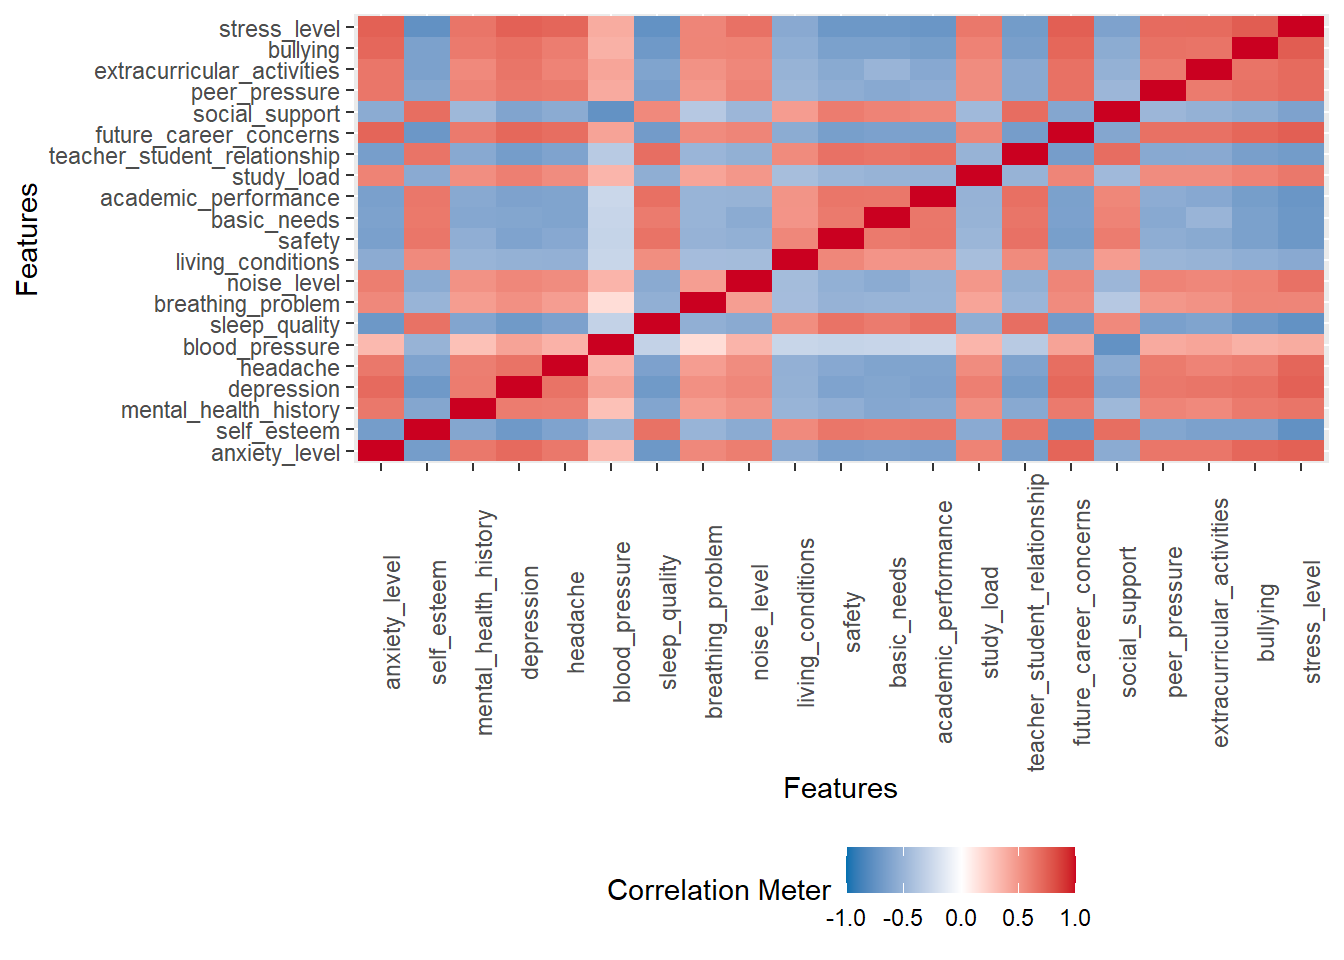
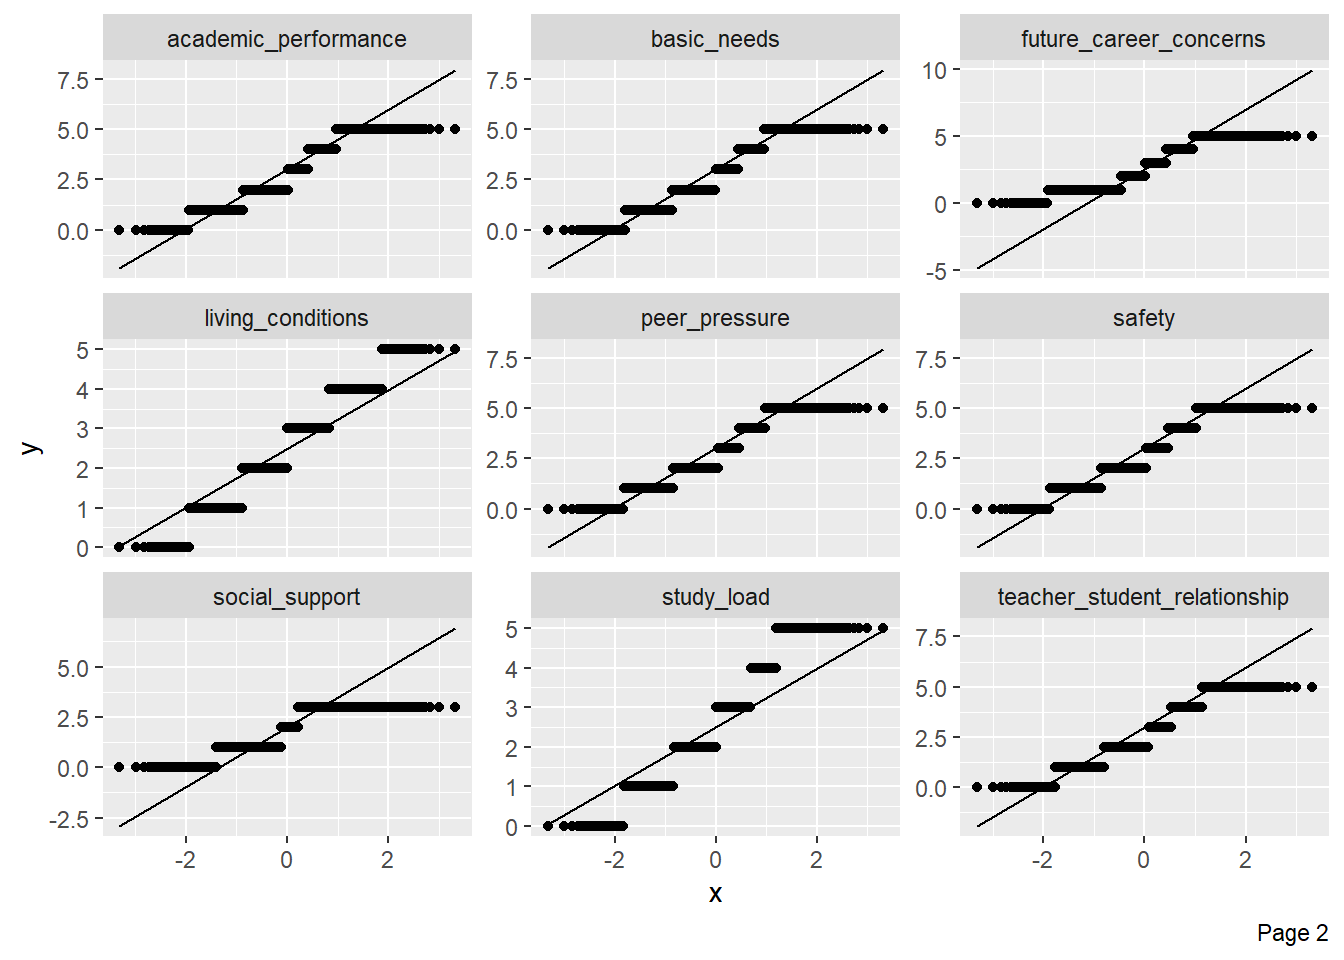
plot_qq(dados)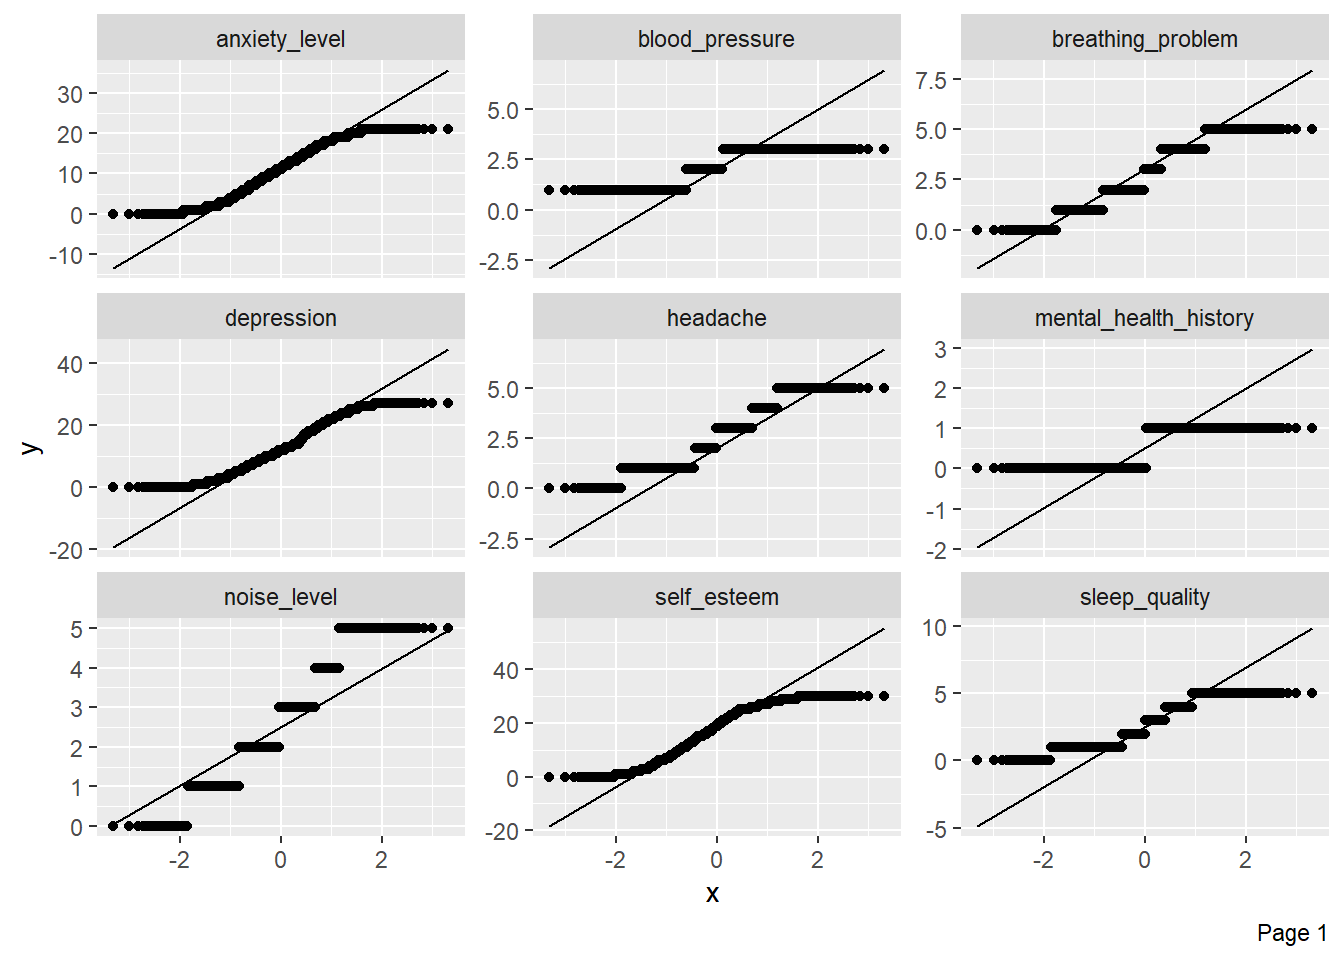
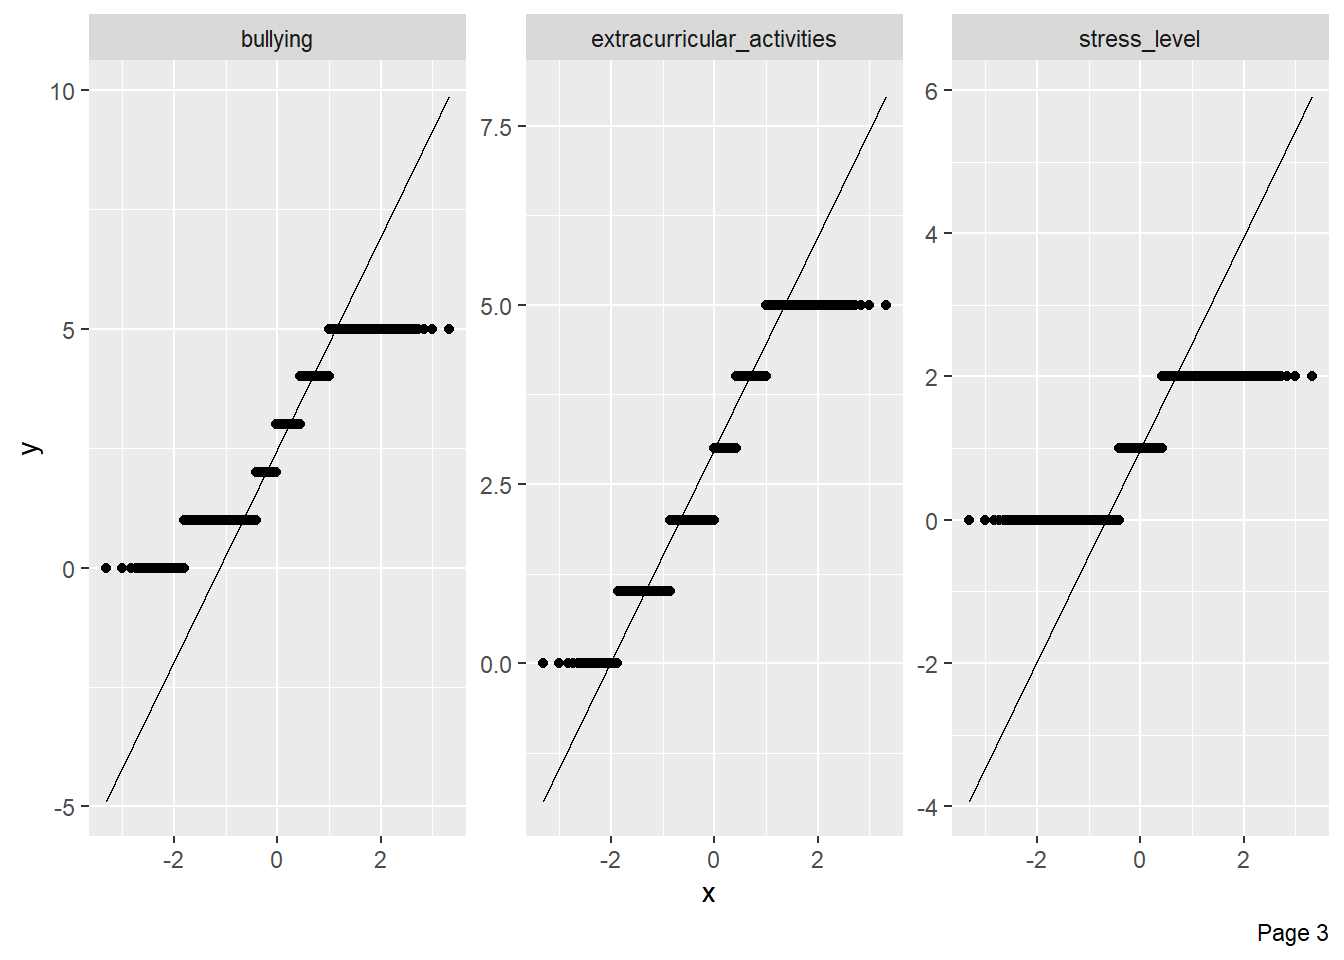
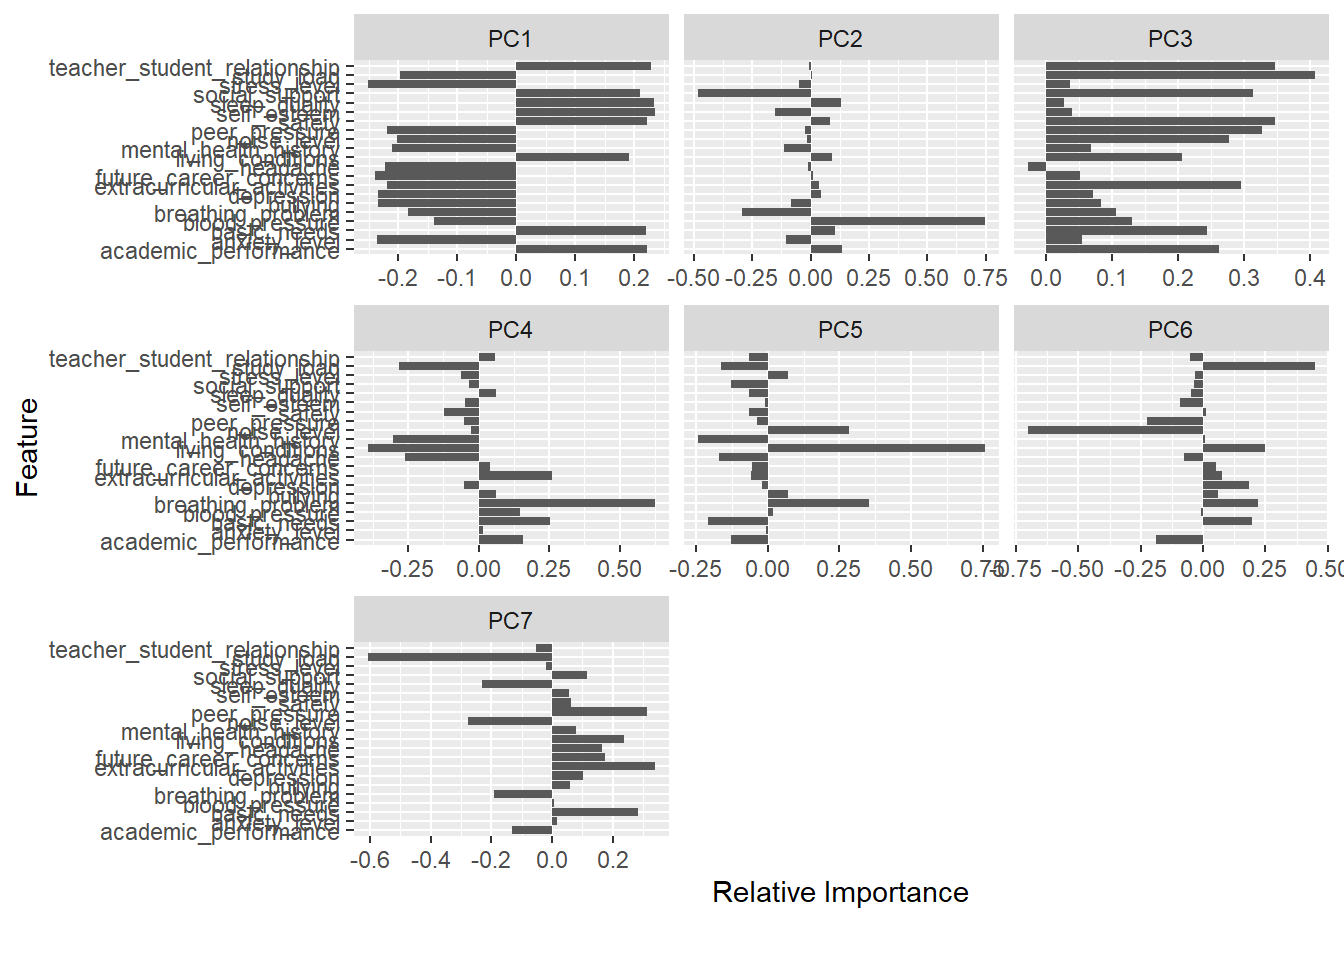
plot_prcomp(dados)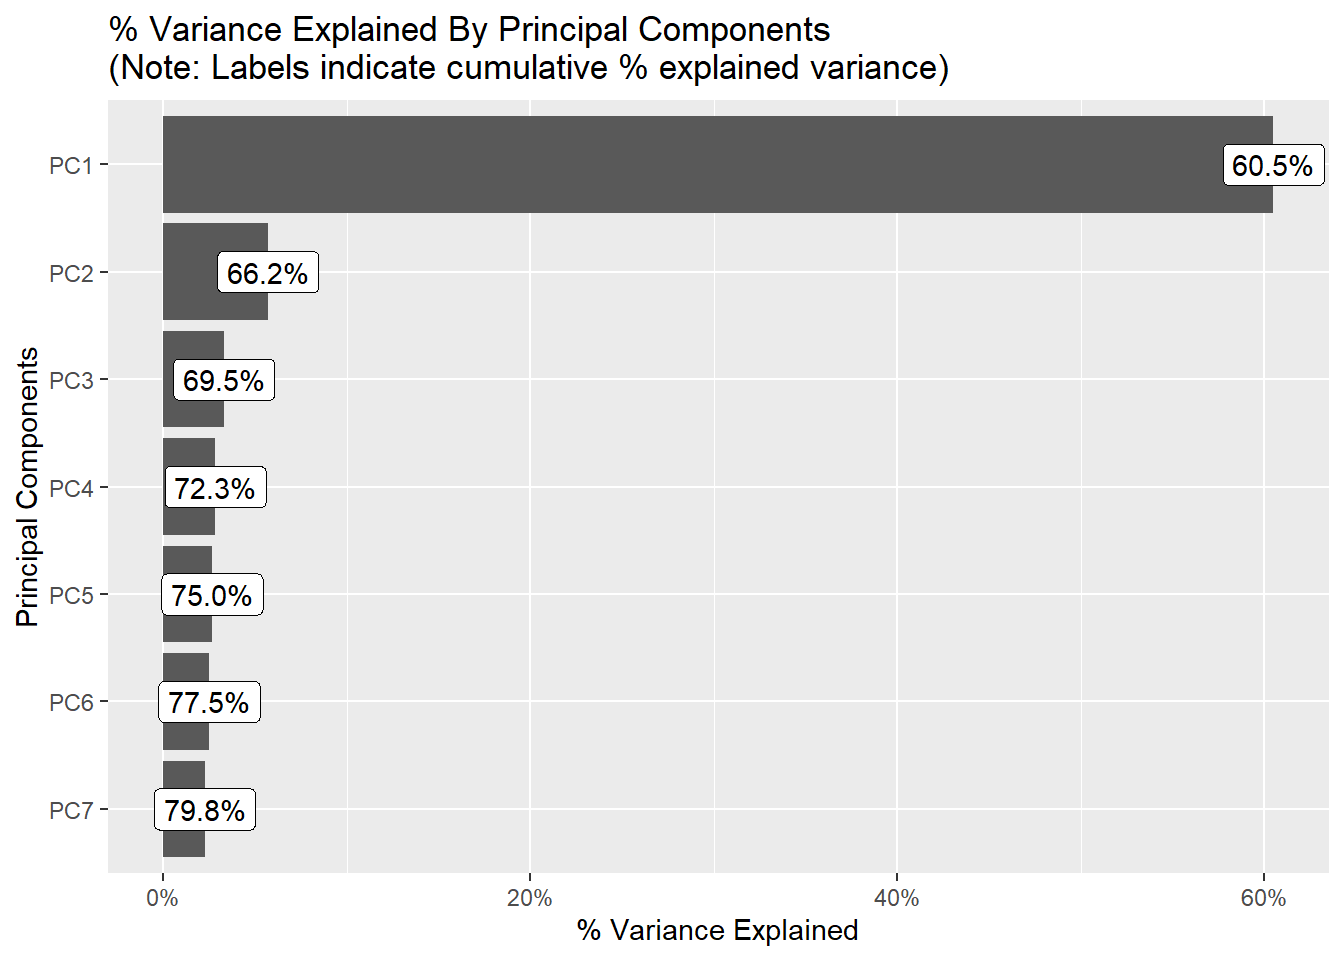
df <- dados[, c("self_esteem", "study_load", "sleep_quality",
"stress_level", "anxiety_level", "depression", "safety")]
plot_boxplot(df, by = "stress_level")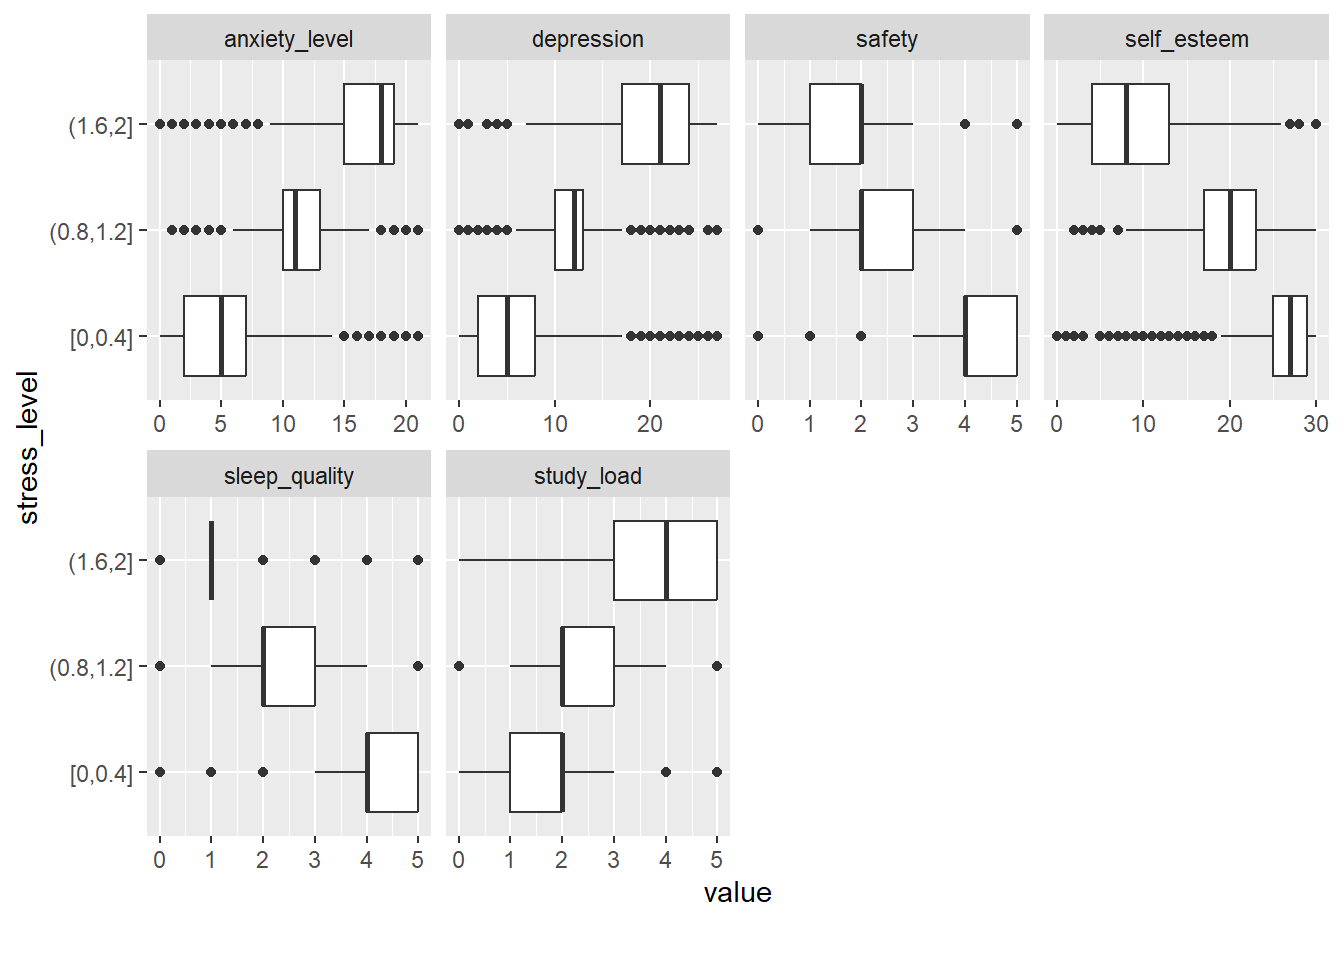
# plot_scatterplot(df, by = "anxiety_level")