# Carregar pacote
library(ggplot2) # Gráficos
library(tidyverse) # Estrutura dos dados
# Carregar dados
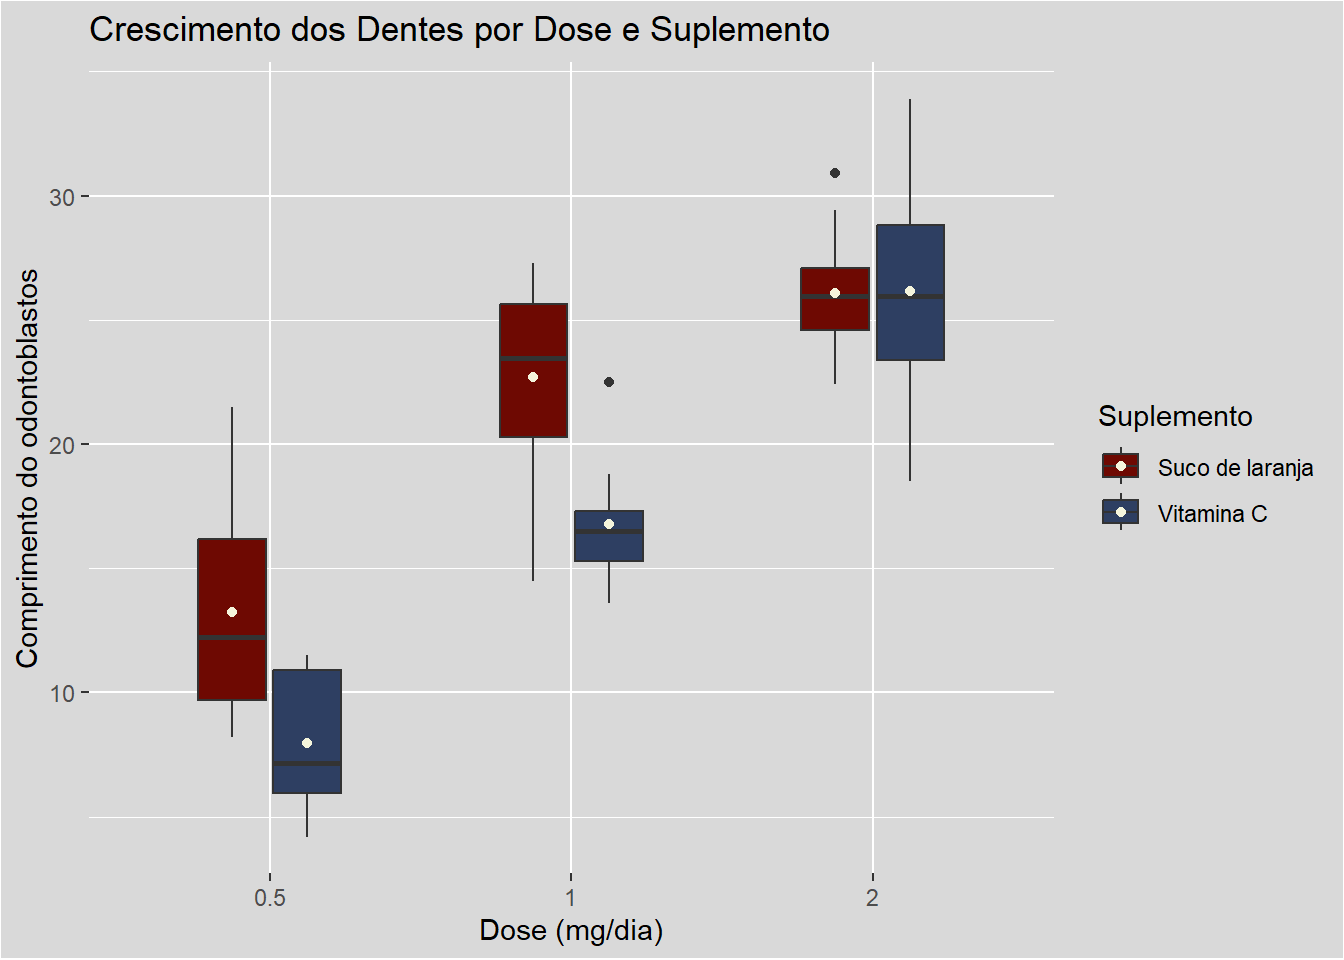
data("ToothGrowth")
head(ToothGrowth) len supp dose
1 4.2 VC 0.5
2 11.5 VC 0.5
3 7.3 VC 0.5
4 5.8 VC 0.5
5 6.4 VC 0.5
6 10.0 VC 0.5# Resumo estatístico
summary(ToothGrowth) len supp dose
Min. : 4.20 OJ:30 Min. :0.500
1st Qu.:13.07 VC:30 1st Qu.:0.500
Median :19.25 Median :1.000
Mean :18.81 Mean :1.167
3rd Qu.:25.27 3rd Qu.:2.000
Max. :33.90 Max. :2.000 # Verificar estrutura
glimpse(ToothGrowth)Rows: 60
Columns: 3
$ len <dbl> 4.2, 11.5, 7.3, 5.8, 6.4, 10.0, 11.2, 11.2, 5.2, 7.0, 16.5, 16.5,…
$ supp <fct> VC, VC, VC, VC, VC, VC, VC, VC, VC, VC, VC, VC, VC, VC, VC, VC, V…
$ dose <dbl> 0.5, 0.5, 0.5, 0.5, 0.5, 0.5, 0.5, 0.5, 0.5, 0.5, 1.0, 1.0, 1.0, …